Debug your MarTech stack in real time
Monitor every event, inspect consent states, control GTM containers, and trace script dependencies across 500+ platforms — with optional AI insights, right inside Chrome DevTools.
Supports 500+ tracking platforms across analytics, advertising, tag management, and more
Everything you need to debug tracking
One DevTools panel replaces dozens of browser extensions, console scripts, and network tab filters.
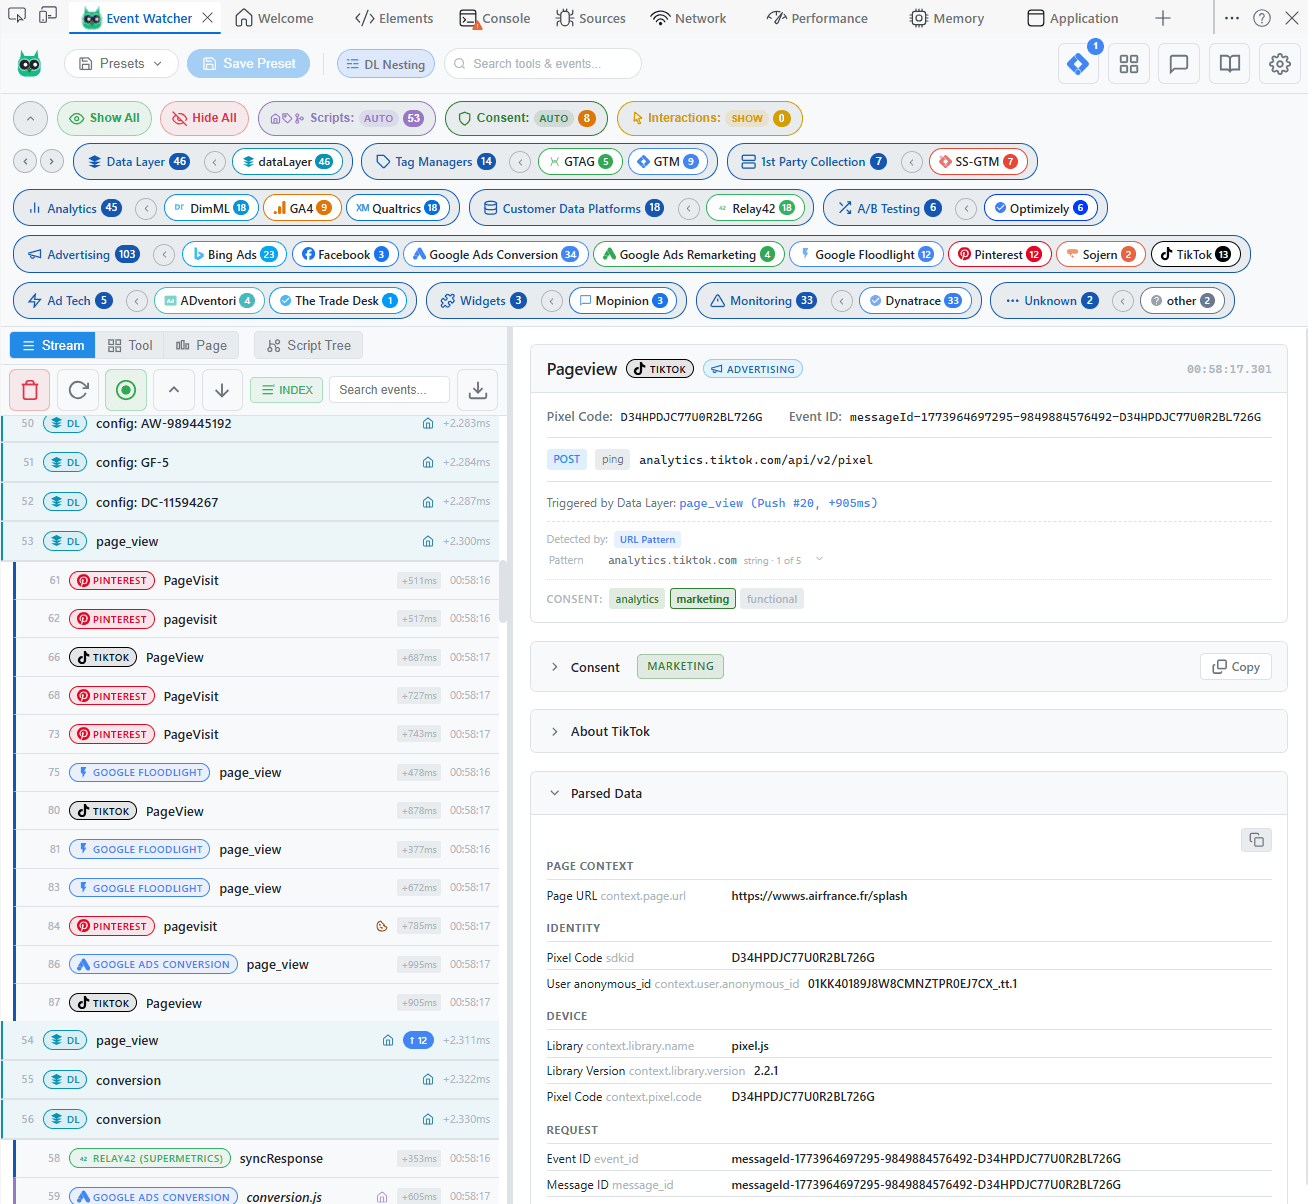
Real-Time Event Stream
See every analytics event as it fires. Network requests, dataLayer pushes, and script loads appear instantly in a unified timeline.
500+ Platform Recognition
Automatically identifies GA4, Adobe Analytics, Meta Pixel, TikTok, Criteo, Segment, and hundreds more with color-coded badges.
AI Insights (Bring Your Own Key)
Optional AI summaries, a session-wide chat, and one-click identification of unknown tools. Use your own Anthropic, OpenAI, or Gemini key — data goes straight to your provider, never through a server of ours.
DataLayer Source Detection
Know where each dataLayer.push() comes from — website code, tag manager, or third-party script — via automatic stack trace analysis.
Structured Event Parsing
Parsed parameters displayed in clean, grouped tables instead of raw query strings. Deep parsing for GA4, Adobe, mParticle, and more.
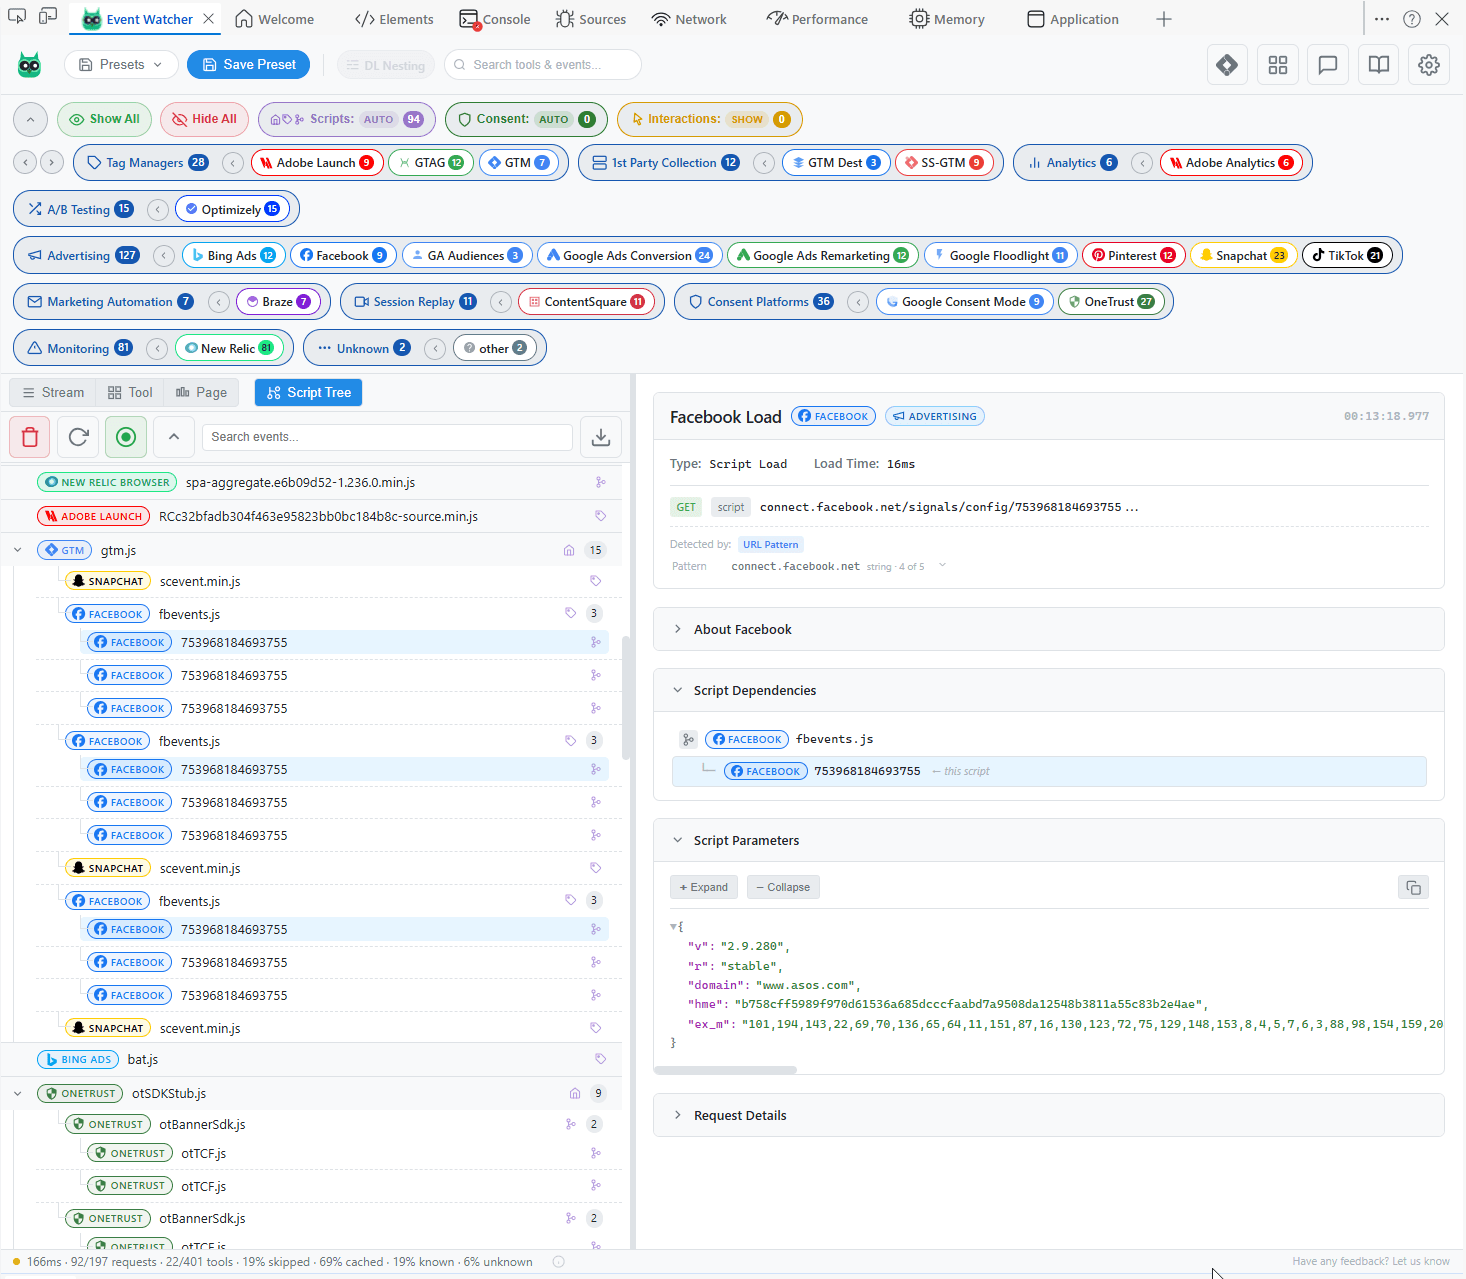
Script Dependency Tree
Visualize which scripts loaded which other scripts. Trace the full loading chain from page to tag manager to tracking pixel.
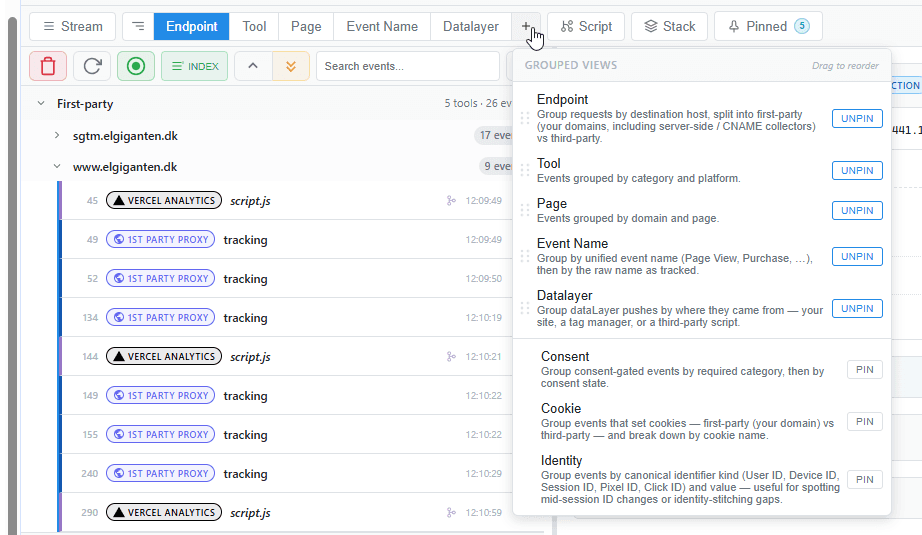
Five View Modes
Stream for live events, Grouped to pivot eight ways, Script Tree for dependencies, Stack for the tool-level MarTech tree, and Pinned to park the events that matter.
GTM Hub
Block, swap, or preview GTM containers on any site. Test tag changes in production without publishing — swap a staging container in, block a live one, or preview a version, with rules that persist across reloads.
Consent Monitoring
Detect CMP platforms automatically and see which consent categories are granted or denied. Spot consent violations — events firing without required marketing or analytics consent.
Custom Endpoint
Forward captured events to your own server or analytics pipeline. Stream real-time event data to any HTTP endpoint for logging, validation, or integration testing.
Privacy First
All event processing happens locally in your browser. No data leaves your machine. Optional anonymous analytics with one-click opt-out.
Smart Filtering
Filter by platform, event type, script source, or consent state. Multi-level filters let you focus on exactly the events you need.
Built Into DevTools
Opens as a native DevTools panel alongside Elements, Console, and Network. No popups, no separate windows — just another tab in your workflow.
AI Insights · Bring your own key
Let AI read the stack for you
Turn a wall of raw tracking calls into something you can reason about — without leaving DevTools. Optional, off by default, and powered by a key you control.
Event summaries
A plain-English read of any event — what it is, what it's tracking, and whether anything looks off.
Session-wide chat
Ask questions across everything you captured. “Which events fired before consent?” — answered.
Identify unknowns
One click to name an unrecognized tool from the shape of its request.
Requests go straight from your browser to the provider you choose. No Event Watcher server, no proxy, nothing logged — and PII redaction is on by default.
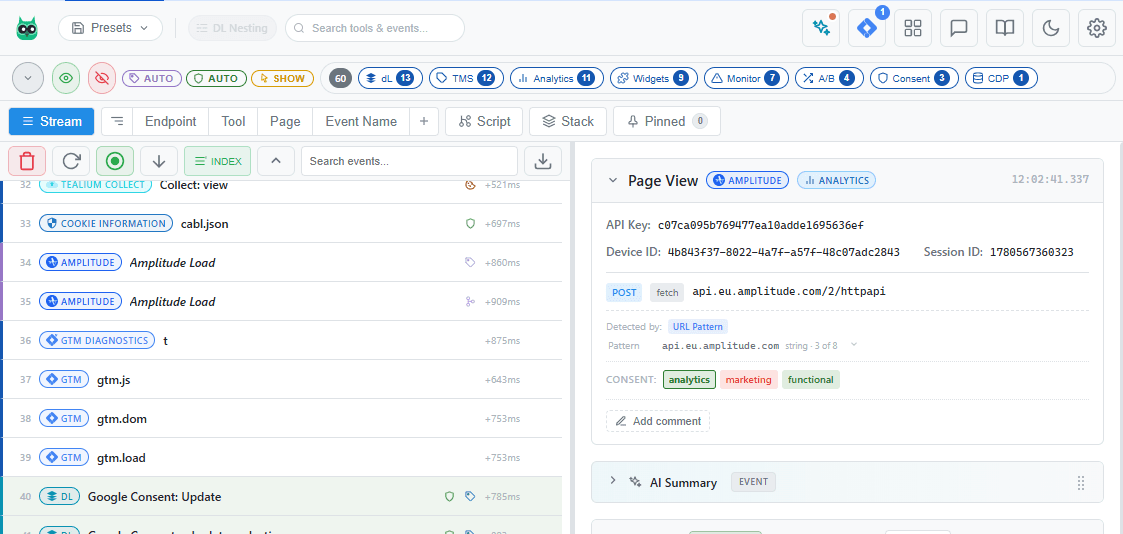
This is a GA4 purchase event firing after checkout completes.
- •Sends
value(128.0),currency(EUR) and 3 items. - Fired after analytics consent was granted.
ad_user_datais denied — the Ads conversion may not register.
See it in action
Event Watcher integrates directly into Chrome DevTools with a clean, information-dense interface.
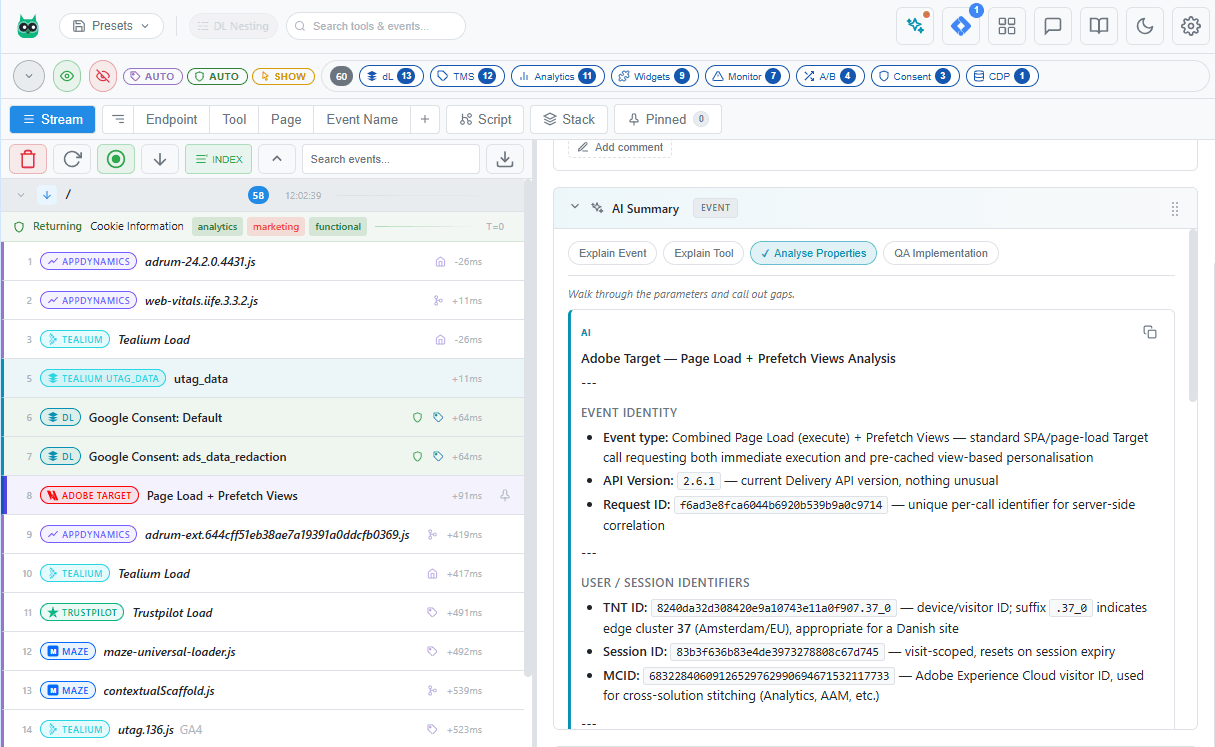
AI Insights
Summarize any event, chat across the whole session, or identify an unknown tool — using your own Anthropic, OpenAI, or Gemini key.
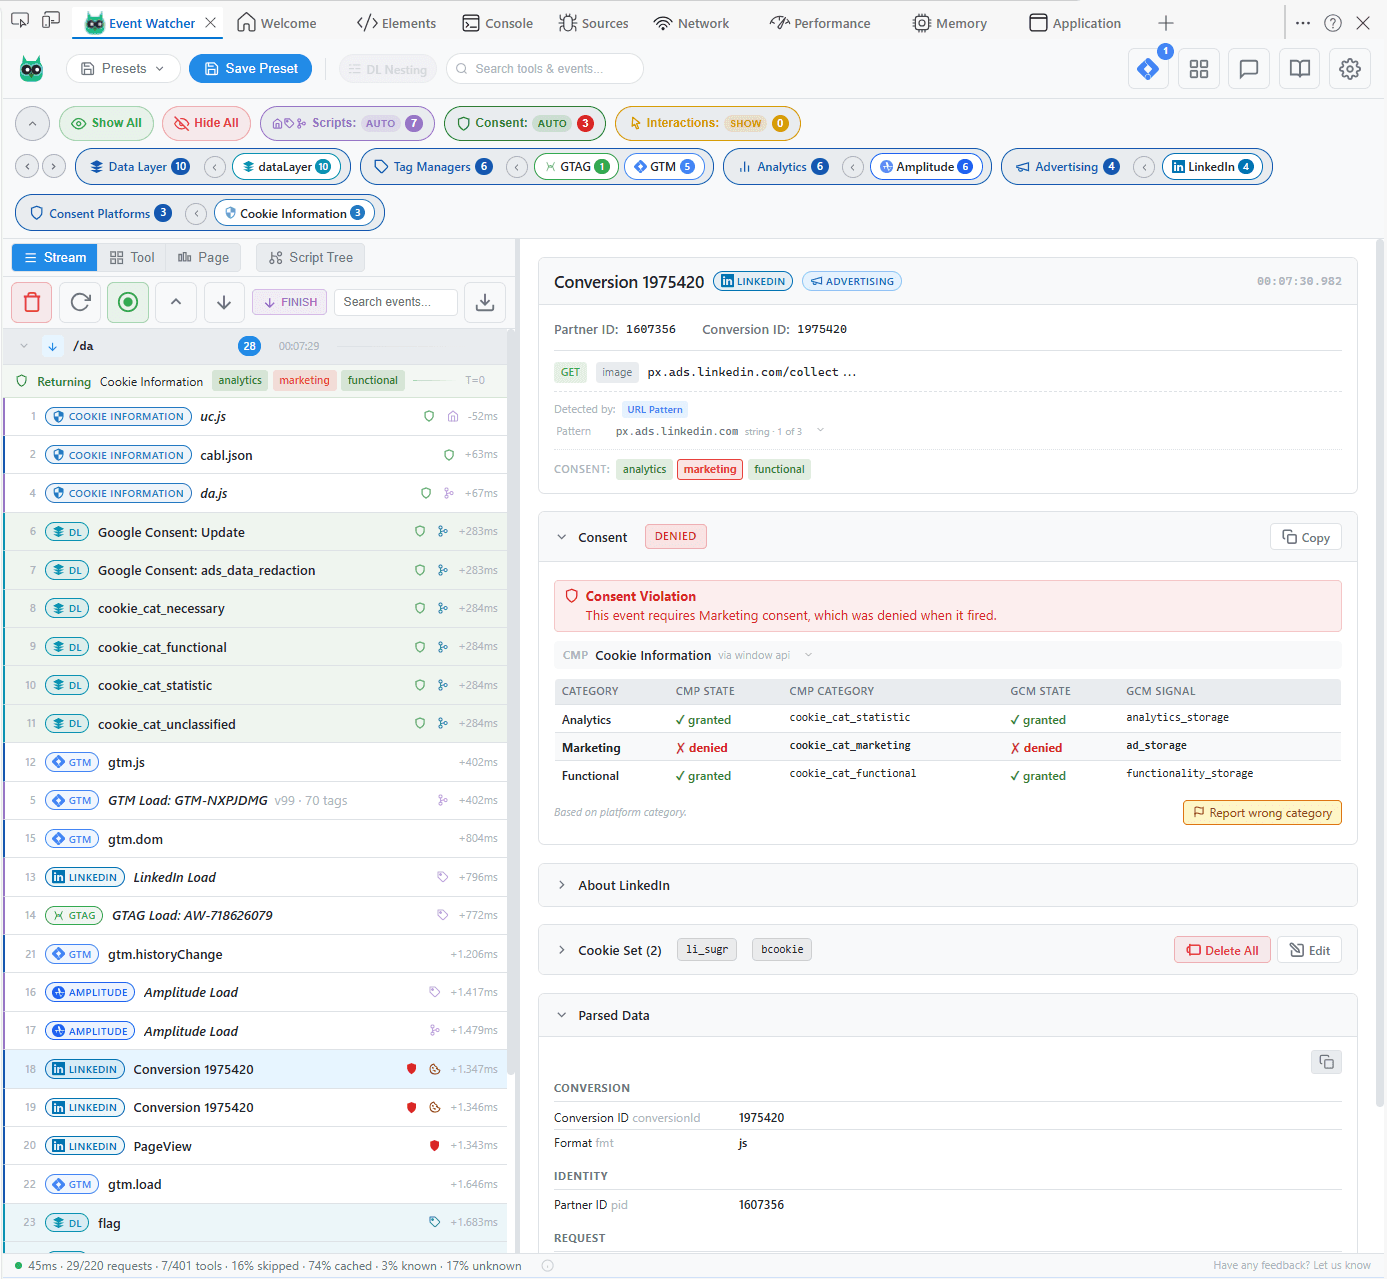
Consent Monitoring
Detect CMP platforms automatically, map consent categories, and spot violations — events firing when required consent is denied.
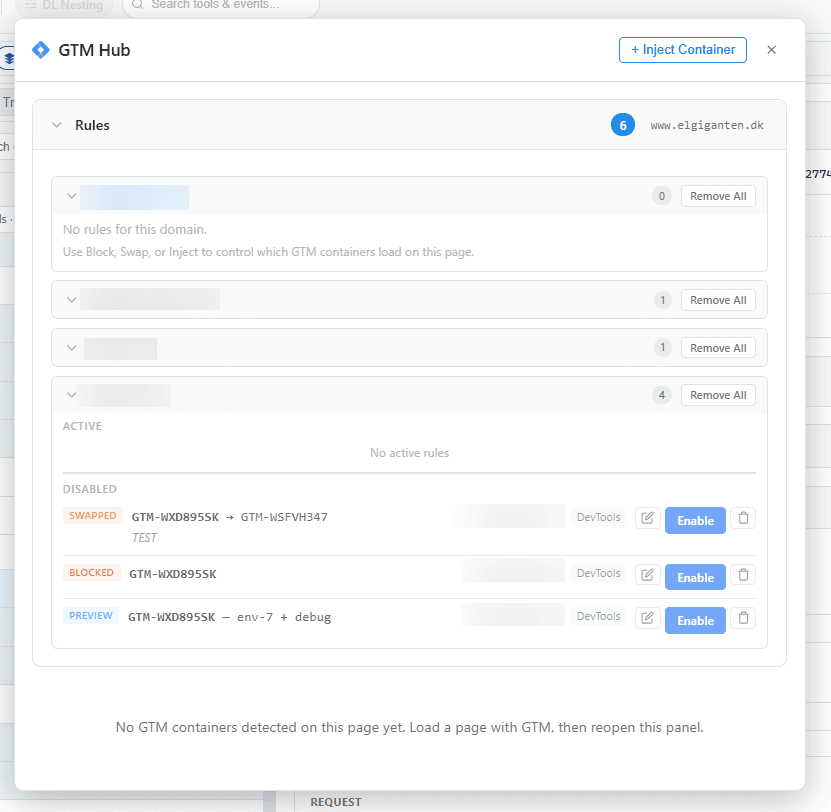
GTM Hub
Block, swap, or preview GTM containers on any site. Test tag changes in production without publishing.
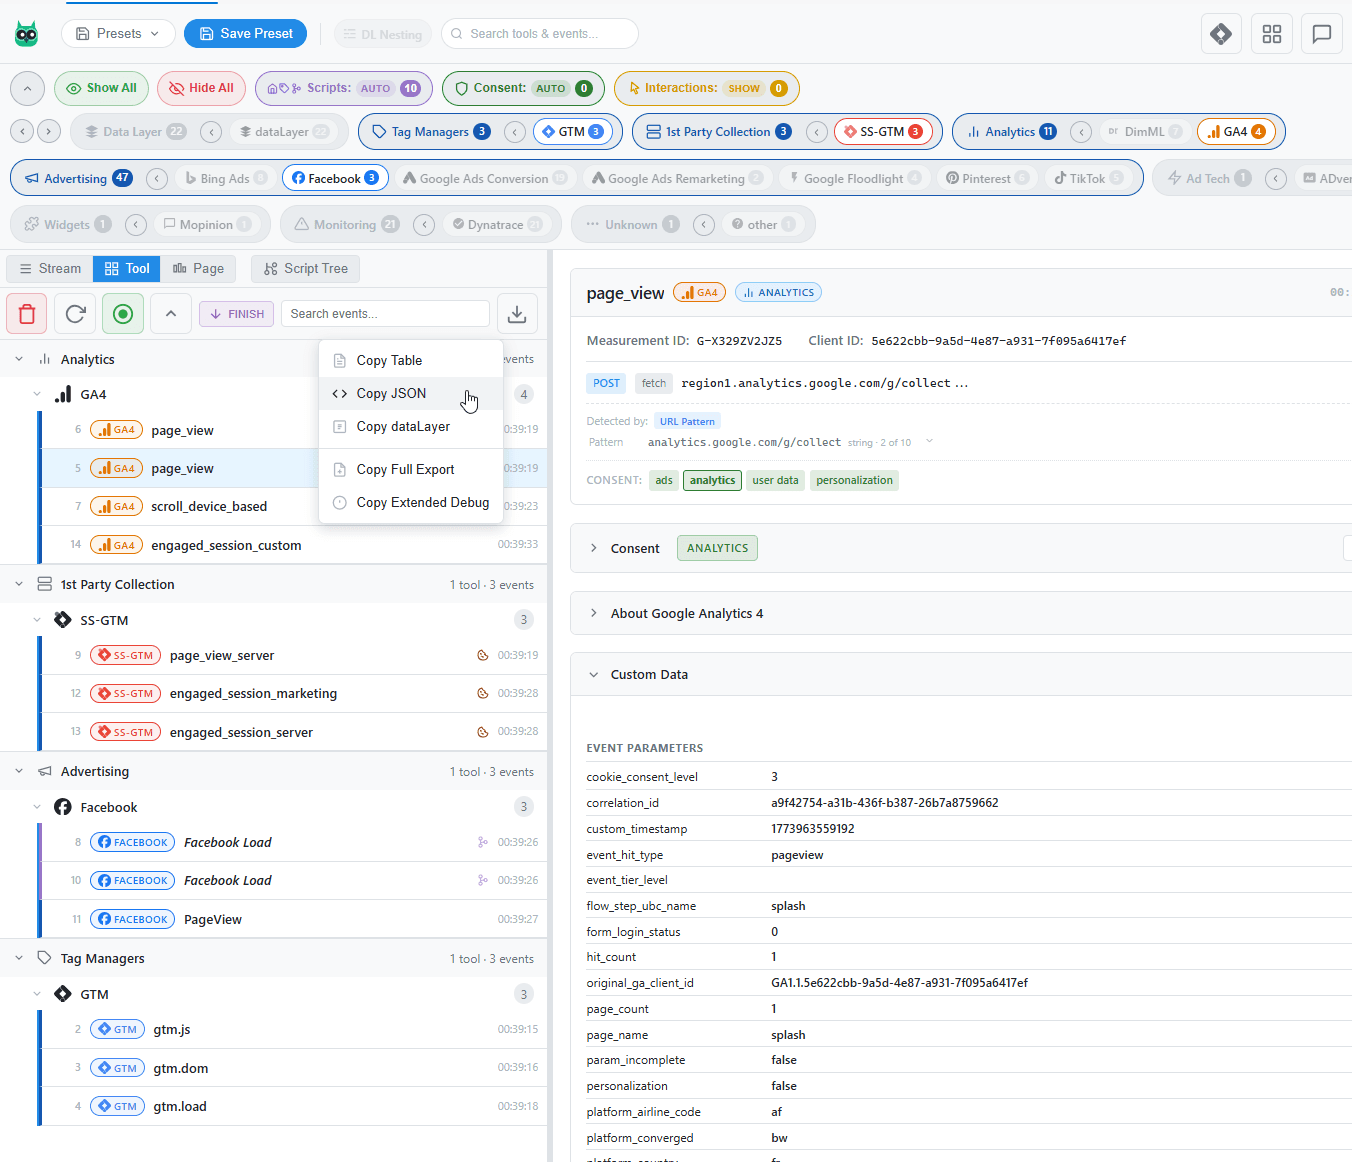
Structured Event Parsing
Every event parsed into clean, labeled fields with copy and export options. No more digging through raw query strings.
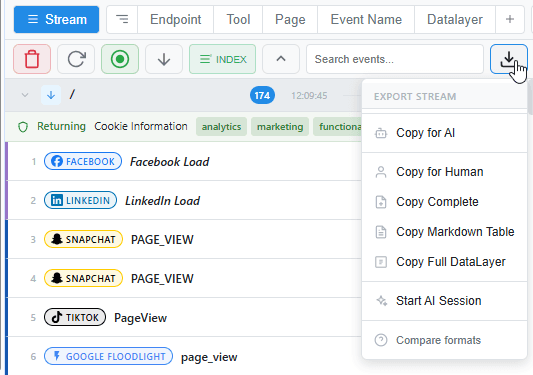
Flexible Export
Copy events for humans, for AI tools (size-budgeted to fit popular chat limits), or complete with raw HTTP — plus HAR and consent-timeline exports.
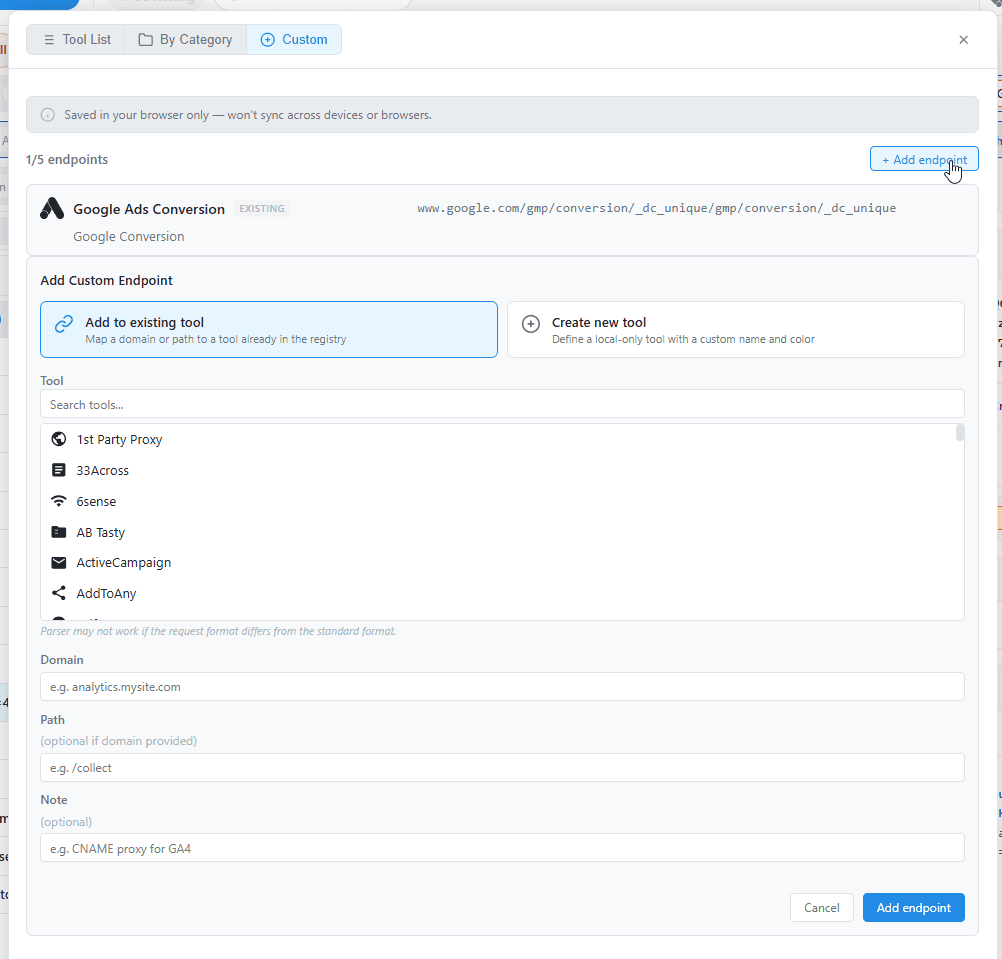
Custom Endpoints
Map custom domains to existing tools or create new ones. Detect 1st-party proxies and CNAME-cloaked tracking endpoints.
Dark Mode
A theme that follows your DevTools — system, light, or dark. Built to sit next to Elements and Network without clashing.
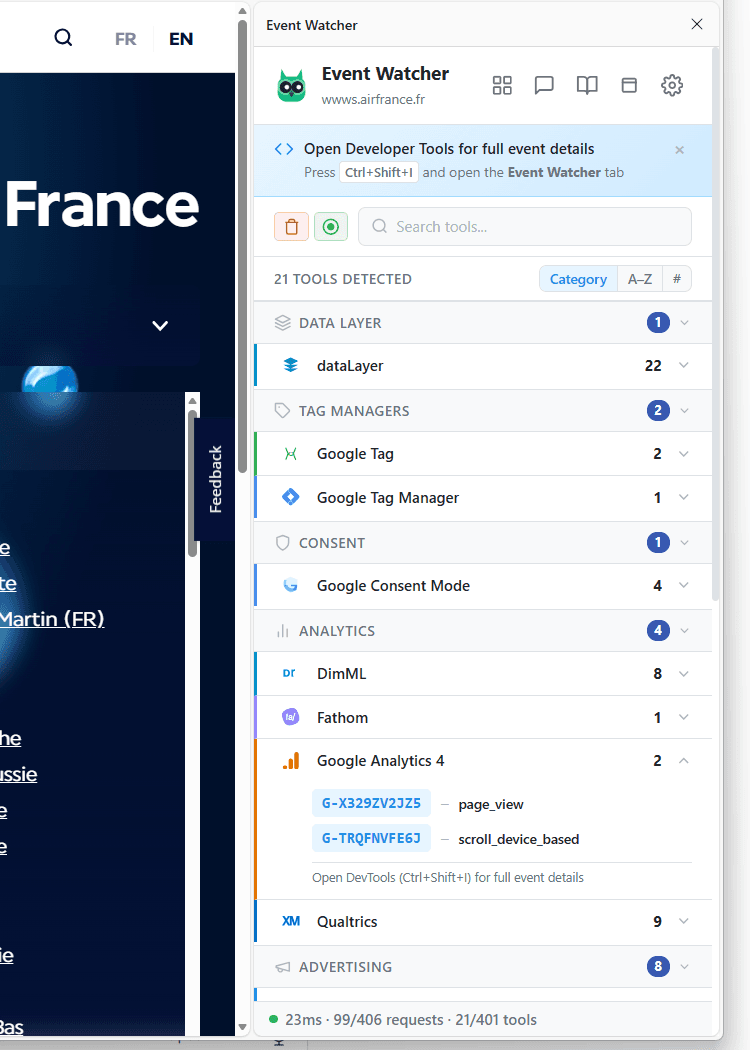
Side Panel
Instant overview of all detected tools on any page — grouped by category — without opening DevTools.
Five ways to explore your data
Switch between view modes to get the perspective you need for the task at hand.
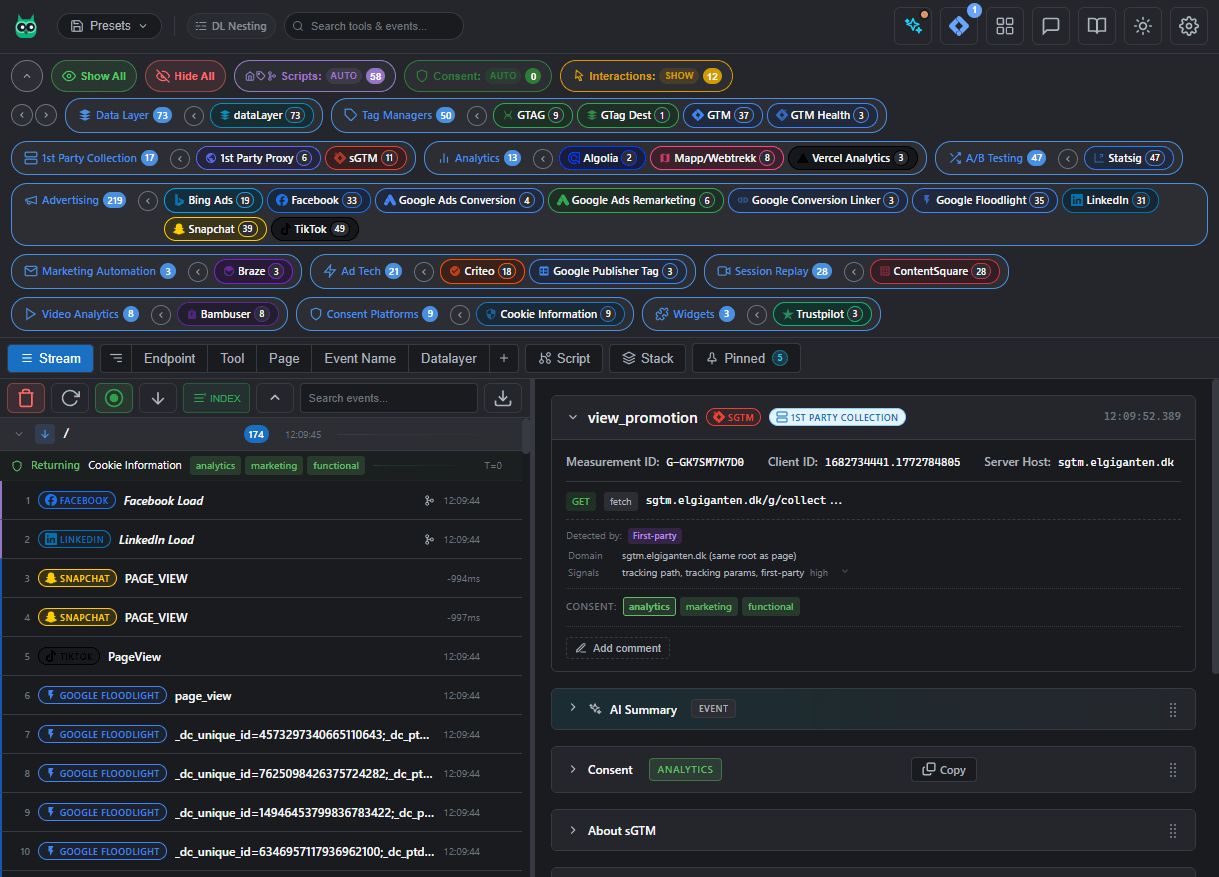
Stream View
The default real-time timeline. Every event appears as it fires — network requests, dataLayer pushes, and script loads in chronological order with platform badges and source indicators.
Grouped View
Pivot the same events eight ways without re-capturing: by Tool, Page, Event Name, Consent Category, dataLayer, Endpoint, Cookie, or Identity. See all GA4 calls, every event firing without consent, or each identity stitched across the session.
Script Tree View
Visualize the full script loading chain. See which scripts loaded which other scripts, from the initial page load through tag managers to individual tracking pixels.
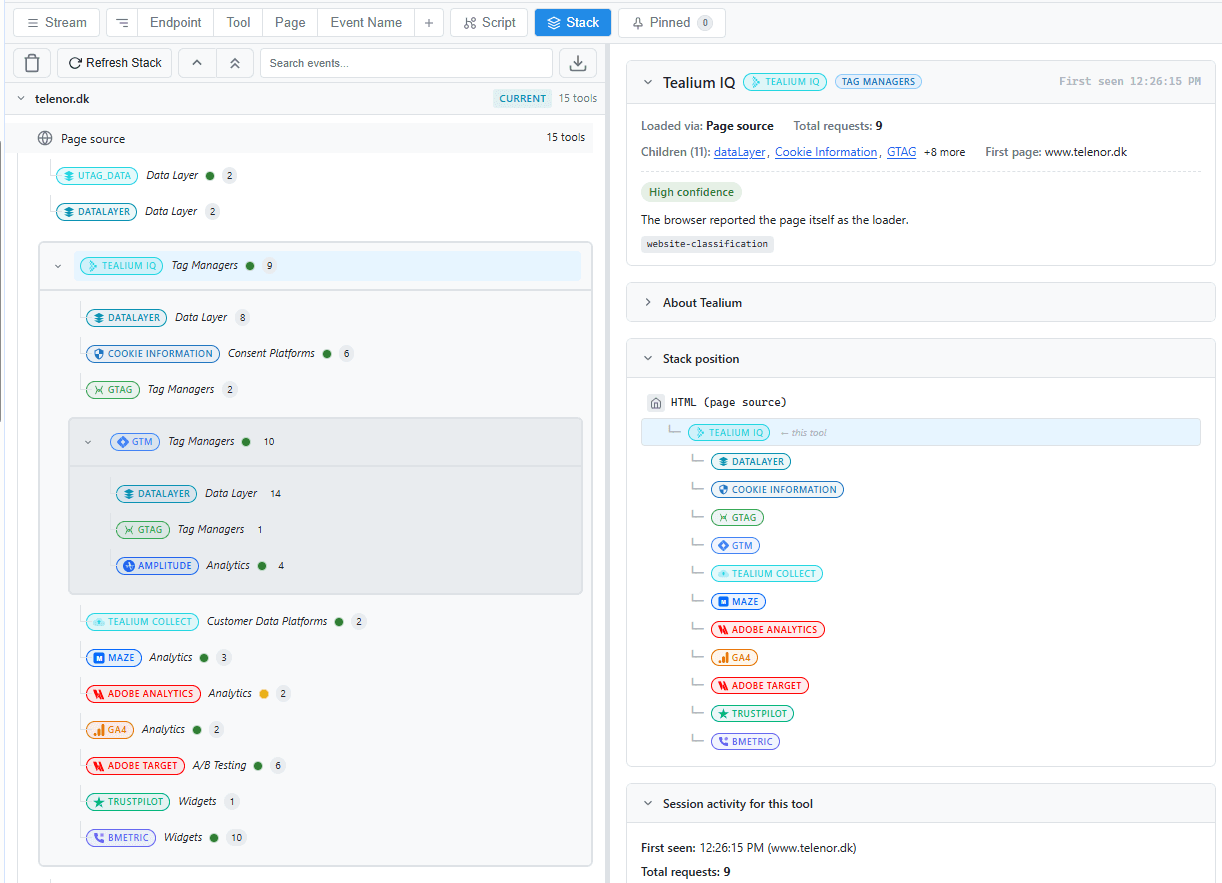
Stack View
The site's whole MarTech stack as a tree — one node per platform, parented by who loaded it: page → tag manager → vendor tools. Each card shows an attribution-confidence dot, and you can export the stack as Markdown, Mermaid, or SVG.
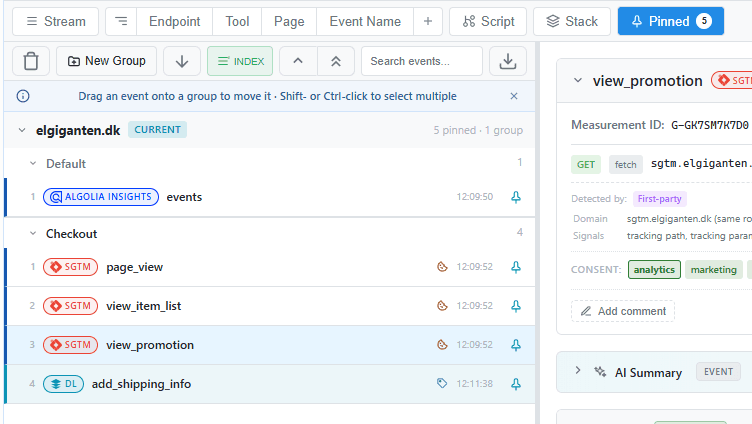
Pinned View
A per-domain parking spot for events. Pin the rows that matter and they survive Clear and page reloads — no more exporting and re-importing just to revisit a handful of events. Add per-pin notes and groups to organize an investigation in place.
500+ platforms across 14 categories
From the biggest analytics suites to niche ad tech — if it sends a network request, Event Watcher recognizes it.
Integration
Built to hand off to MartechStack Builder
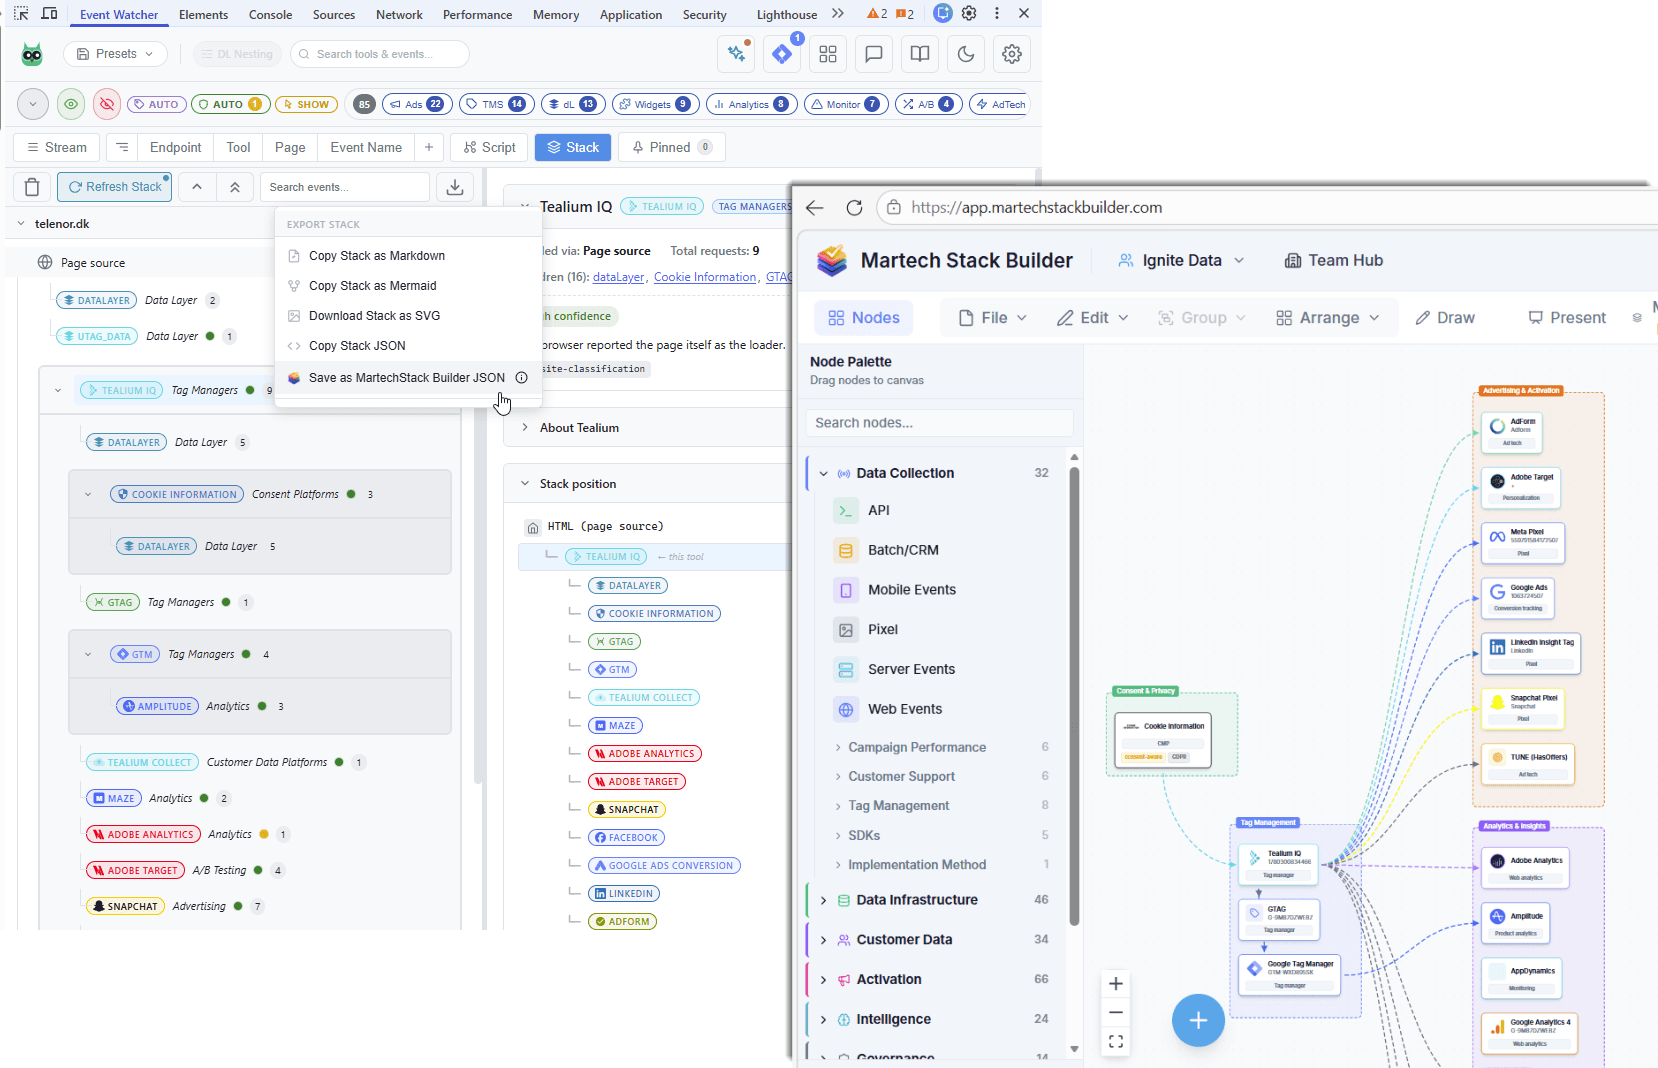
Event Watcher's Stack view captures a site's livemartech stack — every platform that's actually loaded, and how it's wired together: page → tag manager → vendor tools. One click exports that as MartechStack Builder JSON.
Open it in MartechStack Builder — a tool for designing and visualizing martech stacks — via File → Import JSON, and what Event Watcher discovered becomes an editable diagram you can share, present, or hand to a client.
- Vendor logos, brand colours, and capability metadata auto-attach on import
- Nodes arrive pre-categorized, with the page → tag manager → tool relationships intact
- Goes from a live capture to a shareable stack diagram in a few clicks
Event Watcher is listed in MartechStack Builder's integrations directory.
Why Event Watcher?
Built because I needed it — and because learning by doing is the best way to learn.
After 10+ years of benefiting from the analytics community's tools, it felt right to give something back.
Enjoy, and reach out if you have feedback or just want to connect.
Rune Andersen
Copenhagen, Denmark
Start debugging smarter today
Free, no account required. Install in seconds, open DevTools, and see every tracking event on any page.